Microsecond latency Microservice Benchmarked
It is common for a vendor to publish benchmarks with synthetic loads and code. However, what can be reasonably achieve in a real application? In this post, I discuss what we achieve with Chronicle Services for a client’s use case, a framework for low latency microservices.
What are we benchmarking?
In Chronicle Services we favour a high level interface where a publisher makes a method call, and the consumer is called back on the same method. This is slower than more direct access approaches but easier to maintain, esp for Java developers who want to develop in natural Java.
public interface NewOrderSingleListener {
    void newOrderSingle(NewOrderSingle newOrderSingle);
}
A simple interface for messages in and a simple interface for messages out makes writing mocking services, creating data driven and integration tests natural and simple.
When used in the framework, every message is persisted in a logged/replayable manner and the publisher and consumer can be different JVMs or even different machines.
In this performance test, we include the time to:
-
mock the interface
-
serialize the NewOrderSingle with 28 FIX fields, including String(s).
-
write to shared memory
-
read from shared memory in another microservice
-
deserialize a NewOrderSingle
-
make a method call to the component in the service.
A significant portion of the time spent is in string handling. The class for NewOrderSingle was generated for the FIX protocol schema using Chronicle FIX
The test was run for 10,000,000 orders at a rate of 10,000 per second on a dual CPU E5-2650 v4 @ 2.20GHz server running Centos 7. Each service was single threaded. Higher throughputs can be achieved by adding more threads, or with poorer latency profiles i.e the 99.9% is higher.
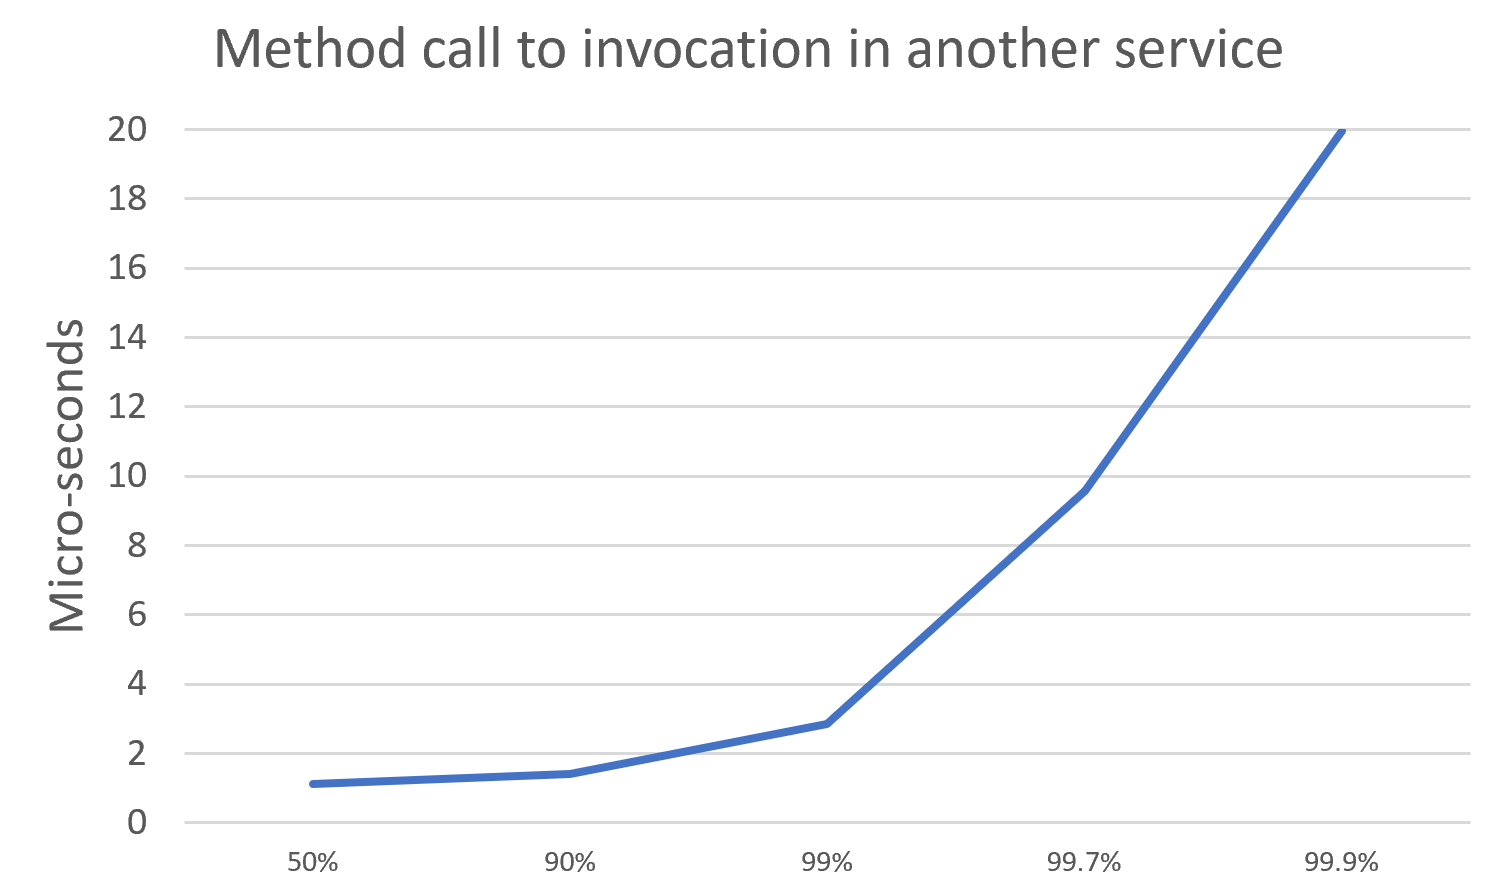
The worst latency was 9.7 ms.
| In this test, no minor or major GCs were triggered. |
What about co-ordinated ommission?
For more information on what is co-ordinated ommission How NOT to measure latency by Gil Tene.
In our case, it doesn’t show in these results as we
-
have a low throughput compared with latency. The messages are 100 micro-seconds apart but typically have pass each message in around 1 micro-second.
-
in higher percentiles, it’s factor however they are not included here as they are very hard to reproduce from one system to another (OS/filesystem/CPU/Vendor/Java version). Even power settings and temperature are factors.
In short, for the region of the chart shown, co-ordinated ommission isn’t a factor.
How does this compare to other messaging solutions?
It is hard to find comparable benchmark results on the latency of messaging solutions. One good option might be to use a benchmark like https://github.com/openmessaging/openmessaging-benchmark although this doesn’t consider the serialization cost which can be relatively high, esp in Java if it triggers GCs. I couldn’t find any published benchmark results other than to say that Pulsar was faster than Kafka.
Most messaging solutions do not include the cost of serialization which can be higher than the cost of messaging. Some only consider the time to publish or consume a message. It is important to choose a benchmark which is representative of your use case.
Many messaging tests only consider throughput, or message latencies in milli-seconds.
How much is open source?
A good place to start is the https://github.com/OpenHFT/Chronicle-Queue which has 1.4k stars and is a key library in building micro services.
If you are intrested in our low latency micro services framework which supports distribution and data driven testing of these micro-services contact sales@chronicle.software