Chronicle Queue storing 1 TB in virtual memory on a 128 GB machine
If you use a standard JVM like the Oracle JVM, or the OpenJDK, you might find that as the heap size grows the performance of your JVM can drop as GC pause time escalates. This tends to be a problem around 32 GB of heap, but it often depends on the application at which point the size of you heap becomes a problem.
One way around this is to use an always concurrent collector such as Azul Zing which is designed to both scale to much larger heap sizes and even reduce the GC pause times for smaller heap consistently.
Data set larger than main memory?
What if your data set sizes are larger than main memory? At this point using the heap doesn’t scale and you need a data store off heap. This could be a database, NoSQL, but these can be dramatically slower depending on what you are doing.
Chronicle supports a huge, persisted dataset.
Chronicle Queue and Chronicle Map allows you to have a persisted store which can be embedded into multiple JVMs on the same server. How does it perform when you exceed main memory size. In this page, we look at Chronicle Queue with favouring for sequential access, scales very well, and shows a little slow down.
What does a JVM which is over 1 TB in virtualsize look like?
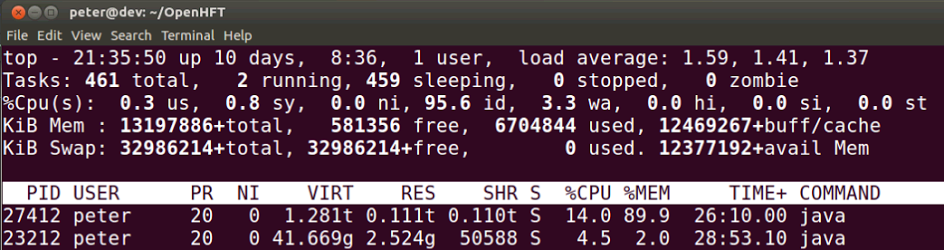
In this example, the JVM with 1 TB of data reports that 0.111t or 111 G is in memory, though the virtual size is 1.281t or 1,281 GB (with heaps and indexes)
But how does it perform? It must get slower.
If you attempted to create and use a 1 TB heap on a machine with 128 GB of memory, it would either fail to start, or with some tuning, start but make your machine unusable. How much does using Chronicle Queue to store the data slow down?
In this test, it writes a bursts of 2 million 512 bytes messsage (1024^3 bytes of data), it then reads the data and waits 8 seconds to let the disk catch up. While the burst rate is about 1 GB/s, the underlying disk doesn’t have the write speed and for this test it averages about 100 MB/s. It takes about 2.5 hours to write 1 TB.
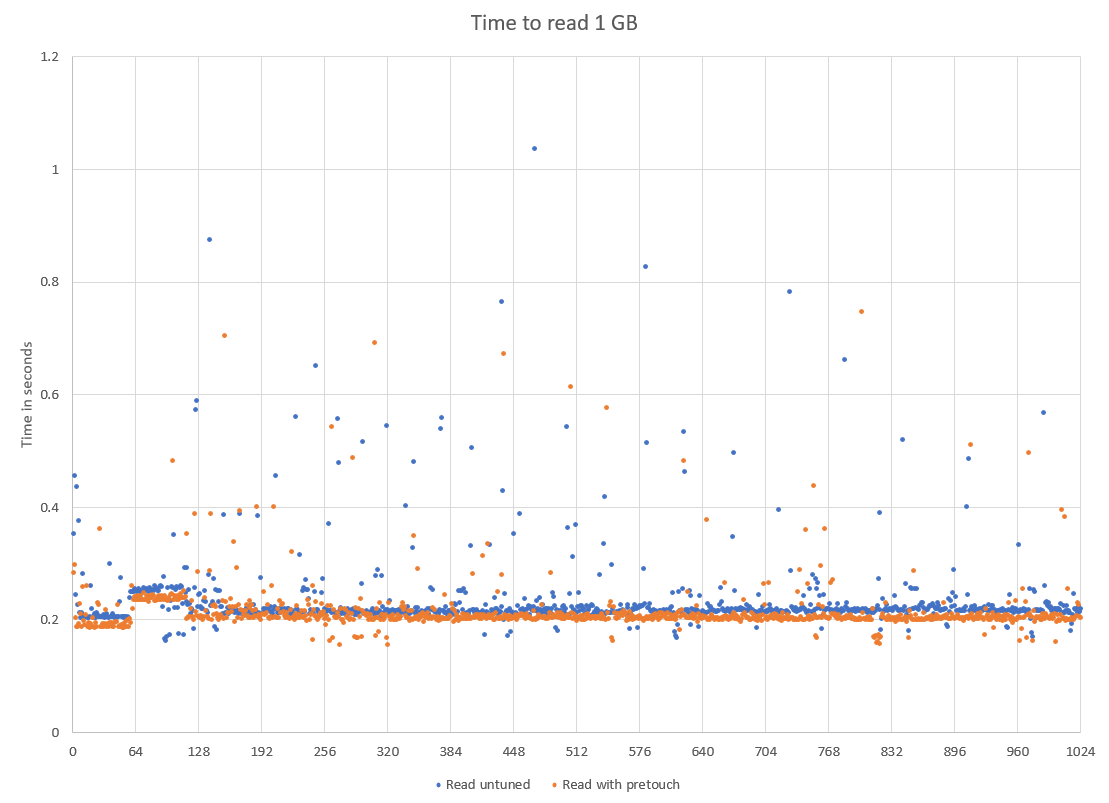
We would expect reads to be consistent as we are always reading something we just wrote.
| While the machine has 128 GB of memory, it has two NUMA regions of 64 GB. This shows around 64 GB has been written. |
The write performance is more dramatic. There is also significant variation as it has to find new memory to write to. This can be mitigated by using a pretouch() call to pre-allocate memory to write to. Normally, this would be run in a background thread, but for the purposes of this test it was run in the same thread but not timed.
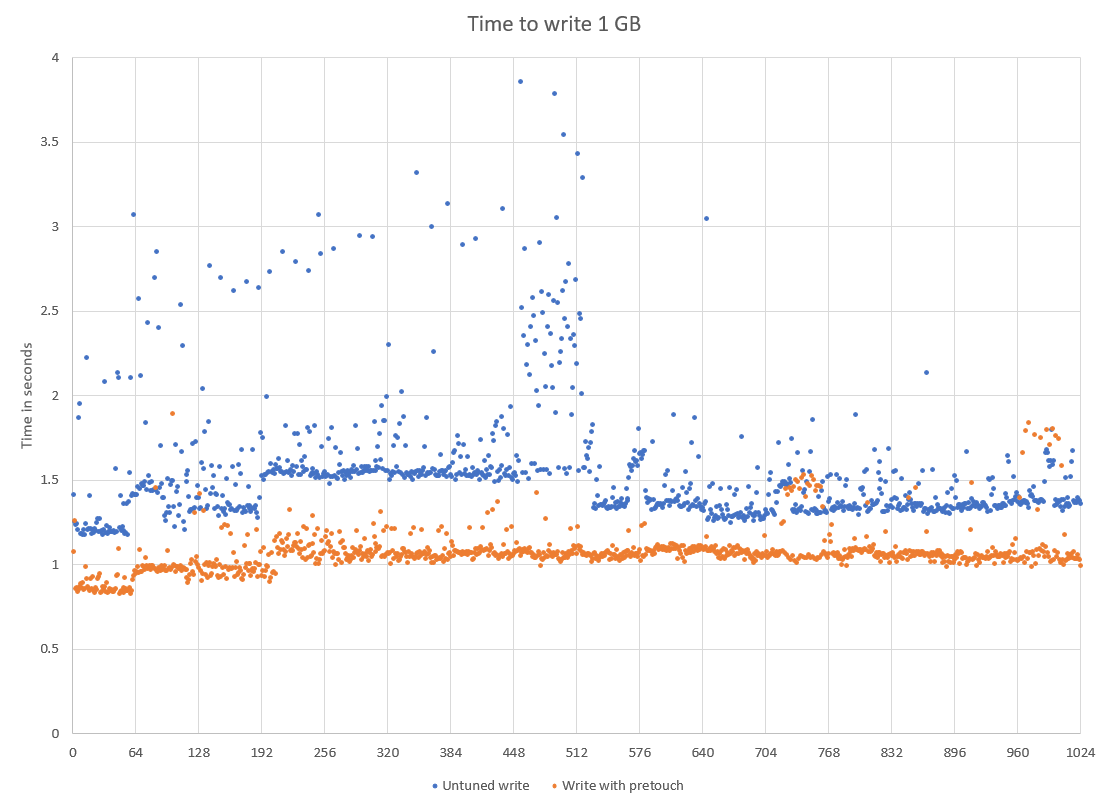
The average time to write a GB for the first 64 GB was 885 ms. From 256 GB in size this takes an average of 1,084 ms which is an increase of 22%.
However, let us consider that the alternative is to pump 2 million records (1 GB) of data to a database, and query it to get the data back. By having it in the JVM, we can read 2 million record in as little as 200 ms using just one thread.
Conclusion
Chronicle Queue performs very well up to the limit of main memory and beyond. It uses very little heap and has only a notional impact on GC pause times even if the dat set size is many times main memory.
You can try this test yourself here RunLargeQueueMain
For more information on Chronicle Queue GitHub source Chronicle Queue Product page
| Having a queue larger than main memory only works on Unix at the moment. On Windows, a cycle e.g. a day, has to fit into main memory. This is something we would like to fix in the future. |