Latency for a set Throughput
Without a set throughput, a latency measurement might be meaningless. Often you see benchmark results with throughput measurements, and sometimes the include latency measurements. However, latency varies with the throughput you perform, and without the throughput you have little idea of what the latency means. Conversely, without an idea of what latencies you find acceptable, the throughput you can achieve for an acceptable latency might not be the maximum throughput you can stress test your system up to.
Benchmarketing
When you are reporting on the throughput, or latencies of your software, you want to put forward the best numbers you can. However, you don’t want to fall into the trap of believing your own benchmarketing. As a technologist, you want tools that will help you find problems you need to solve.
A common question I get is; how do I convince my manager to allow me to spend more time optimising the application. The simple solution is to avoid benchmarketing and use tools which help you find problems.
To start with, look at the latencies of your system at given throughputs. Look not at the average latency or typical latency, but rather start with the 99%ile (worst 1 in 100 latency). After you have worked on the 99%ile, you can try improving the 99.9%ile. The 99%ile is often 4x higher than the typical latencies, even in well tuned systems, and can be many orders of magnitude higher if not tuned.
Co-ordinated ommission
One of the ways in which your testing tools can lie to you is to back off whenever your tested system isn’t performing well. Often this is a consequence of flow control.
Flow control is a very useful technique for avoiding overloading your system and improves performance. Flow control does a good job of smoothing out any bad latencies. However, if your purpose is to look for problems, it is not what you want. You don’t want a system to be able to tell a load generator: 'can you hold off for a while, I am having trouble keeping up'.
Gil Tene coined this benchmarking blind spotting of your load testing tool Co-ordinate Ommission, as your testing tool is effectively conspiring with the tested system to hide or dramatatically down play the importance of poor latencies.
A simple way to correct for this is to measure the end-to-end latency from the time a test should have started, not when it actually started. By doing this you bias the result to include any failure of the testing tool to start the test on time.
Setting the Throughput
How can we calculate the time a test should have started? We need to test for a given throughput. The simplest approach is to have a spacing between tasks and wait for that time to be reached.
long ratePerSecond = 1_000_000;
long intervalBetweenTasks = 1_000_000_000 / ratePerSecond;

long next = System.nanoTime() + intervalBetweenTasks;

for (int i = 0; i < tests; i++) {
    while (System.nanoTime() < next) {
        // busy wait
    }

    long start = next; (1)
    performTask();
    long time = System.nanoTime() - start;

    next += intervalBetweenTasks;
}| 1 | The important step is to not use the time it actually started, rather, the time it should have started. |
How can we measure latency without a set throughput?
The simple answer is; you can’t. A latency by itself only tells you what can be achived for some throughput, and you might assume this is the latency for low throughputs, but it might not be.
Some systems perform worse with lower throughputs. For our software, we tend to see a small worsening of the performance below 50K events/second. This is due to the CPU not running as hot and the underlying interruptions of the system becoming more prominent. e.g. Your OS has a timer interrupt, typically 100 times a second, which you cannot turn off. At 100K events per second, this will impact your 99.9%ile, at 10K events per second this will impact your 99%ile, and below 100 events second it will impact every event.
Latency Test for Chronicle Queue replication
The following charts time how long it takes to:
-
Write a 40 byte message to a Chronicle Queue.
-
Have the write replicated over TCP.
-
Have the second copy acknowledge receipt of the message.
-
Have a thread read the acknowledged message.
The test is run for ten minutes and the distribution of latenices plotted.
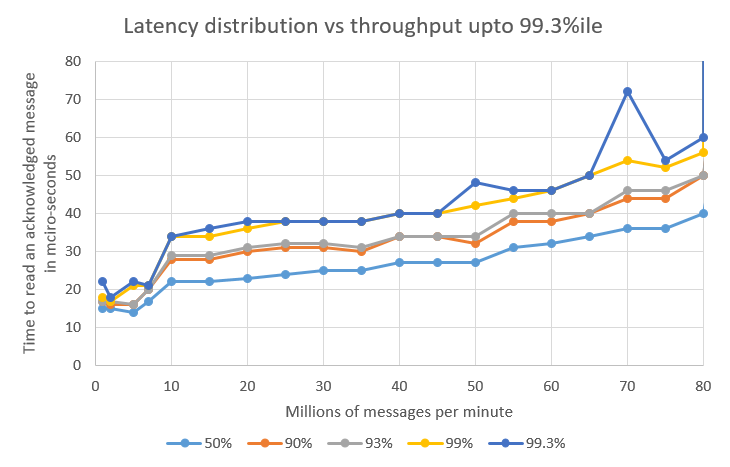
| There is a step in latency at around 10 million message per second jumps as the messages start to batch. At rates below this, each message can be sent individually. |
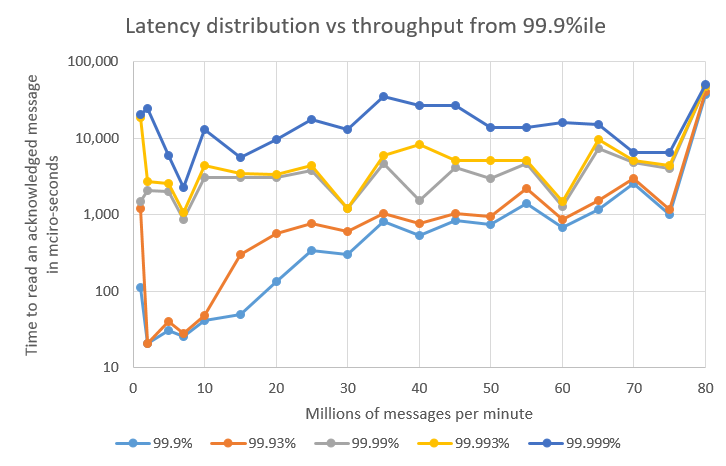
The 99.99%ile and above are believed to be delays in passing the message over TCP. Further reserach is needed to prove this. In any case, these delays are much the same regardless of the throughput.
The 99.9%ile and 99.93%ile are a function of how quickly the system can recover after a delay. The higher the throughput, the less head room the system has to recover form a delay.
Summary
In the test above, the typical latency varied between 14 and 40 micro-seconds, the 99%ile varied between 17 and 56 micro-seconds depending on the throughput being tested. Notably, the 99.93% latency varied between 21 micro-seconds and 41 milli-seconds, a factor of 2000.
Acceptable Latency |
Throughput |
< 30 micro-seconds 99.3% of the time |
7 million message per minute |
< 20 micro-seconds 99.9% of the time |
20 million messages per minute |
< 1 milli-seconds 99.9% of the time |
50 million messages per minute |
< 60 micro-seconds 99.3% of the time |
80 million message per minute |
Conclusion
Your choice of what is an acceptable latency can determine the throughput a suspect can support and meet your Service Level Agreement. Conversely, your choice of throughput can change the latency distribution you get.
When measuring performance you have to consider both latency distribution and throughput.